Market Time Lapse
An interactive map of company and industry market caps and valuations through time.
Work in progress
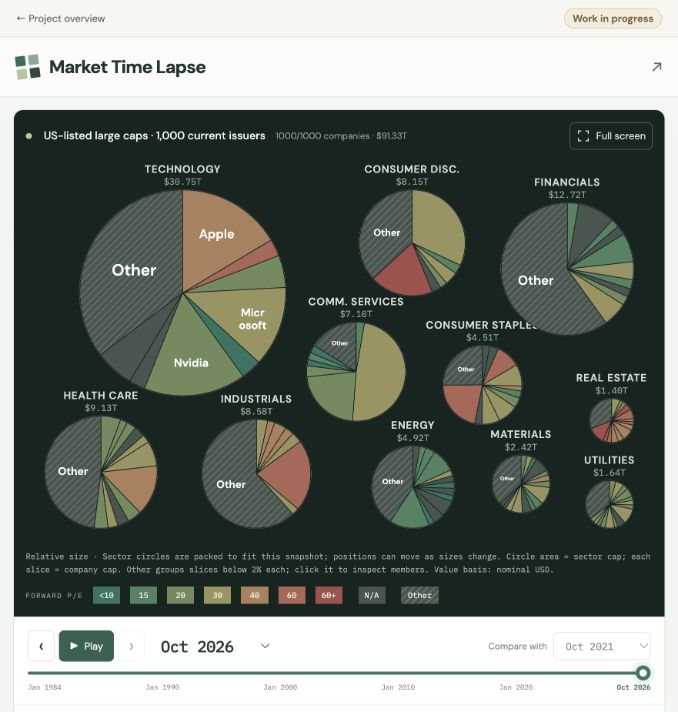
Market Time Lapse explores how company and industry market caps and valuations change over time. Move through monthly snapshots, play the timeline, and select a company to explore its market cap and valuation history.
A separate US-listed large caps view covers 1,000 issuers, including large new listings without waiting for S&P membership. The S&P 500, DAX, CAC 40, FTSE 100 and Nikkei 225 retain their own views. The country comparison places the S&P 500, DAX, CAC 40, FTSE 100 and Nikkei 225 side by side on one USD scale. You can filter by sector, switch between tickers and company names, compare market size on a fixed scale, and adjust historical market caps for inflation.
This is an evolving project using saved public-source data, not a live feed. Coverage varies by company, market and date; missing values are shown explicitly in the app. Historical company views use the selected current roster; they do not reconstruct past index or top-1,000 membership. Source details and methodology are included in the tool.