World Cup xG Analysis
Expected Goals (xG) is a relatively new stat that despite its flaws often gives us interesting insights. Here are some of them on past World Cups. Which World Cup champions had the best attack? Which one the best defense? What seems more important? Who were the teams that could have won but underperformed?
Sanity checks
Before looking at individual tournaments, a useful first check is whether xG roughly lines up with tournament advancement. It does: teams with higher xG and especially higher net xG are more likely to move toward the right side of the result axis. The relationship is not perfect, which is exactly where the interesting World Cup stories are.
Team xG by tournament result
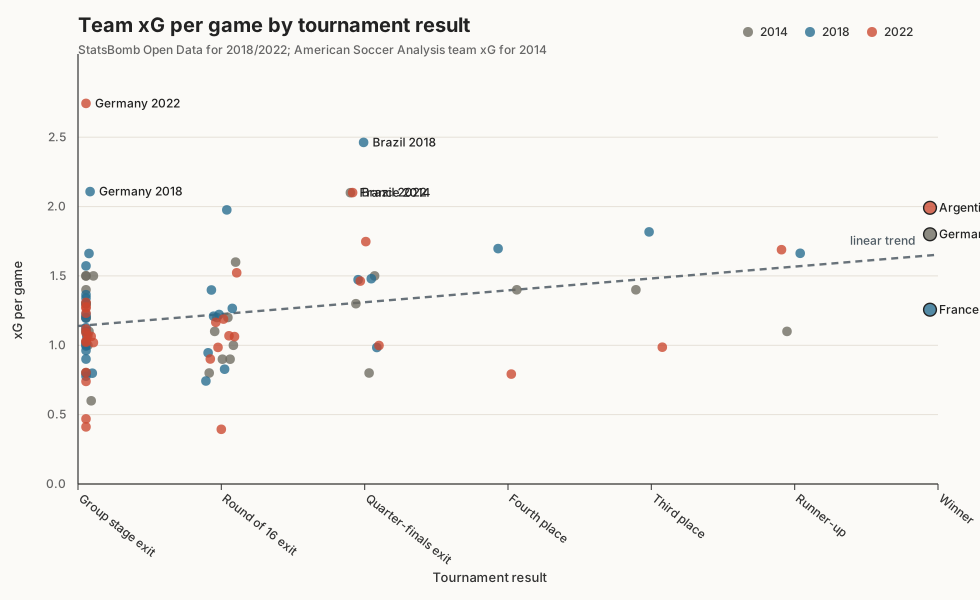
xG/game is predictive of success in the broad sense, but still noisy in a short knockout tournament. Regressing xG/game on ordered tournament result gives R² = 0.10 with p = 0.0015. Some strong attacking teams exited early, while the winners were not always the highest-xG teams in their tournament.
Team net xG by tournament result
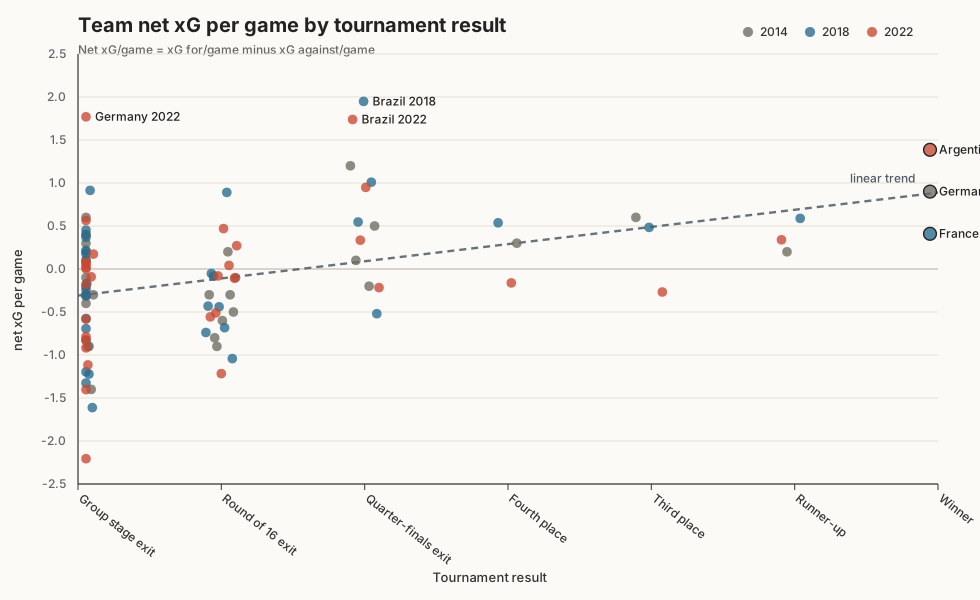
Net xG is the cleaner sanity check because it includes defensive shot quality. The general upward pattern is clearer here: better net xG teams tend to advance further, and the regression improves to R² = 0.17 with p = 0.00003. Outliers point to teams that either underperformed or rode finishing, goalkeeping, game state, or penalty variance.
Time trend in xG
Team xG over time
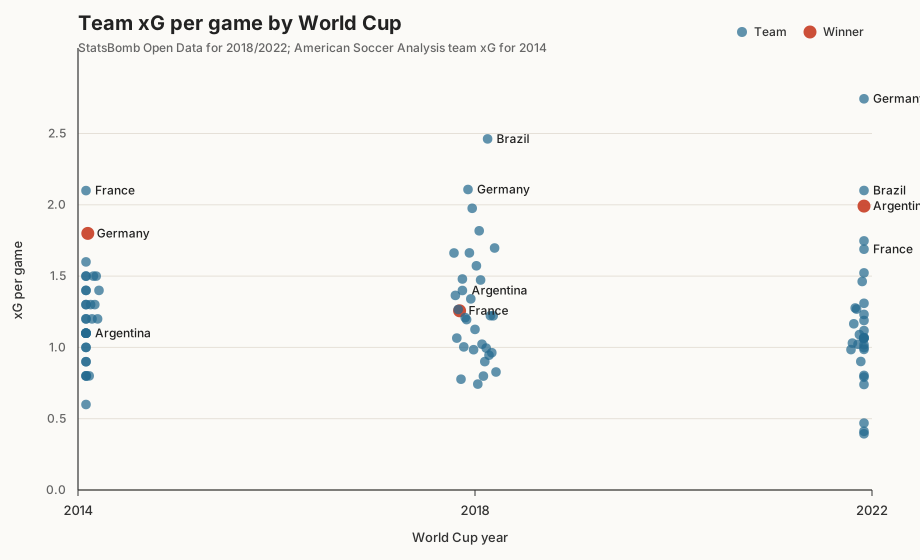
With three team-level xG tournaments, this is still more of a baseline view than a trend analysis. The main visual takeaway is that high xG per game does not map neatly to tournament success: Germany 2014 and Argentina 2022 won with strong attacking profiles, but Brazil 2018, Germany 2022, and France 2014 all ranked very high and exited earlier.
Team net xG over time
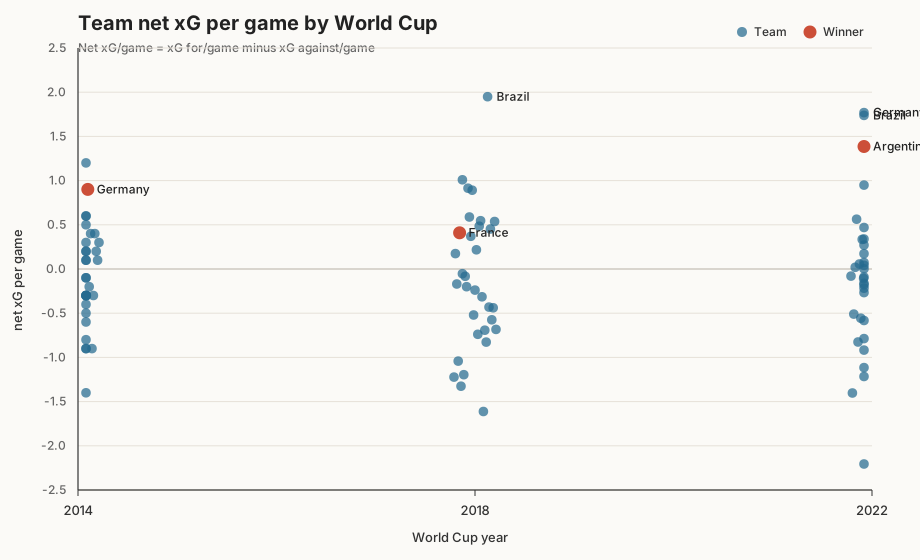
Net xG adds defensive shot quality to the same view. Brazil 2018, Germany 2022, and Brazil 2022 lead the current complete-tournament sample, while Argentina 2022 is the strongest winner by net xG/game. There is no meaningful time trend in this small sample: year predicts xG/game with R² = 0.001 and p = 0.744, and net xG/game with R² = 0.00009 and p = 0.928.
Top 3 teams by xG per game
2022 World Cup
| Rank | Team | Matches | xG/game | xG against/game | Tournament result |
|---|---|---|---|---|---|
| 1 | Germany | 3 | 2.74 | 0.97 | Group stage exit |
| 2 | Brazil | 5 | 2.10 | 0.36 | Quarter-finals exit |
| 3 | Argentina | 7 | 1.99 | 0.61 | Winner |
2018 World Cup
| Rank | Team | Matches | xG/game | xG against/game | Tournament result |
|---|---|---|---|---|---|
| 1 | Brazil | 5 | 2.46 | 0.51 | Quarter-finals exit |
| 2 | Germany | 3 | 2.11 | 1.19 | Group stage exit |
| 3 | Spain | 4 | 1.98 | 1.08 | Round of 16 exit |
2014 World Cup
| Rank | Team | Matches | xG/game | xG against/game | Tournament result |
|---|---|---|---|---|---|
| 1 | France | 5 | 2.10 | 0.50 | Quarter-finals exit |
| 2 | Germany | 7 | 1.80 | 0.90 | Winner |
| 3 | Switzerland | 4 | 1.60 | 0.80 | Round of 16 exit |
World Cup winners by xG per game
| World Cup | Winner | Matches | xG/game | xG against/game | Total xG |
|---|---|---|---|---|---|
| 2022 | Argentina | 7 | 1.99 | 0.61 | 13.94 |
| 2018 | France | 7 | 1.26 | 0.85 | 8.80 |
| 2014 | Germany | 7 | 1.80 | 0.90 | 12.60 |
By net xG per game, Argentina 2022 finished at +1.39, Germany 2014 at +0.90, and France 2018 at +0.41.
FIFA rank context
| World Cup | Winner | Pre-tournament FIFA rank | Ranking date | xG/game | Net xG/game |
|---|---|---|---|---|---|
| 2022 | Argentina | 3 | 2022-10-06 | 1.99 | +1.39 |
| 2018 | France | 7 | 2018-06-07 | 1.26 | +0.41 |
| 2014 | Germany | 2 | 2014-06-05 | 1.80 | +0.90 |
The xG leaders were not always the top-ranked teams entering the tournament:
| World Cup | xG/game rank | Team | xG/game | Pre-tournament FIFA rank | Tournament result |
|---|---|---|---|---|---|
| 2022 | 1 | Germany | 2.74 | 11 | Group stage exit |
| 2022 | 2 | Brazil | 2.10 | 1 | Quarter-finals exit |
| 2022 | 3 | Argentina | 1.99 | 3 | Winner |
| 2018 | 1 | Brazil | 2.46 | 2 | Quarter-finals exit |
| 2018 | 2 | Germany | 2.11 | 1 | Group stage exit |
| 2018 | 3 | Spain | 1.98 | 10 | Round of 16 exit |
| 2014 | 1 | France | 2.10 | 17 | Quarter-finals exit |
| 2014 | 2 | Germany | 1.80 | 2 | Winner |
| 2014 | 3 | Switzerland | 1.60 | 6 | Round of 16 exit |
This gives the project a useful contrast between prior team strength and tournament chance creation. Early examples: France 2014 and Germany 2022 produced elite xG profiles despite entering outside the top ten by FIFA rank, while Germany 2014 and Argentina 2022 combined strong pre-tournament rank with strong xG profiles.
This first pass sums all non-shootout StatsBomb shots for 2018 and 2022, including penalties taken during normal or extra time. Penalty-shootout attempts are excluded from match xG totals, but shootout outcomes are used to infer tournament results for tied knockout matches. The 2014 rows use American Soccer Analysis’s team-level xGF/xGA rates rather than shot-level StatsBomb events.
Coverage
| World Cup | Team-level xG source | Match-level xG source |
|---|---|---|
| 2022 | StatsBomb Open Data | StatsBomb Open Data, 64 matches |
| 2018 | StatsBomb Open Data | StatsBomb Open Data, 64 matches |
| 2014 | American Soccer Analysis | Not currently included |
Historical FIFA rankings are available from December 1992 to September 2024 in the GitHub dataset, which makes them usable for World Cups from 1994 onward. For this project I use the last FIFA ranking release before tournament kickoff: